

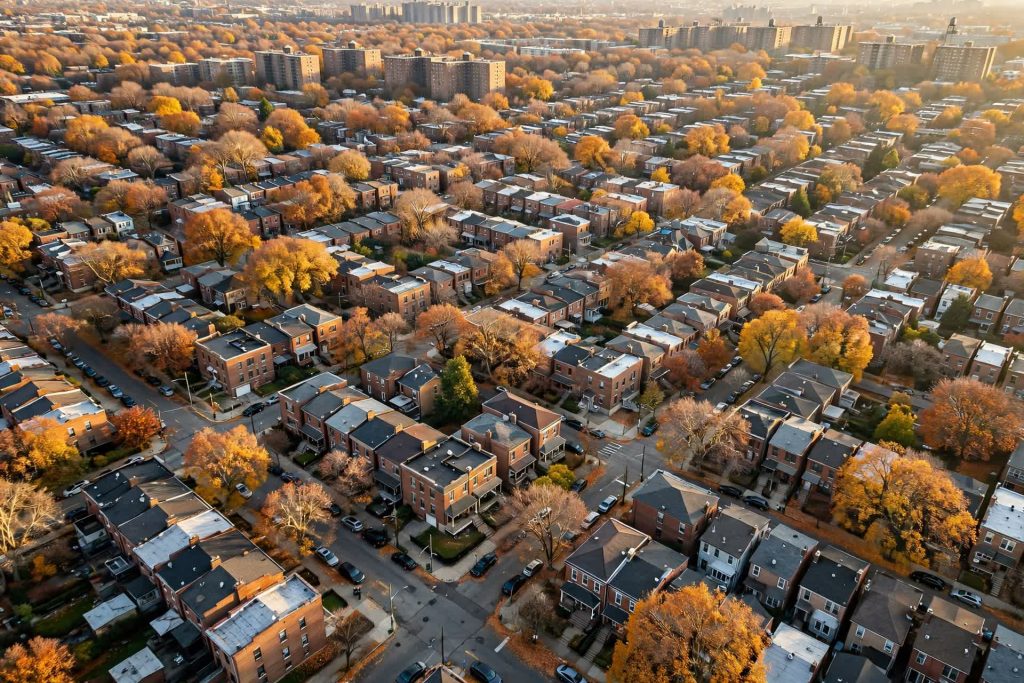
Every quarter we dig into the OneKey MLS numbers for Queens County, covering residential 1 to 3 family homes, coops, and condos. Here is what July, August, and September told us, and what we think it means if you are buying or selling this fall. Have questions? Give us a call or shoot us an email. 718-968-5538 / info@nyhometeams.com
In this report:
Q3 at a glance
- Median closed price (quarter average): $777,500, up 7.4 percent year over year
- Closed sales: 2,182, up 1.6 percent year over year and up 16.0 percent vs Q2
- Active listings (quarter average): 7,189, up 1.1 percent year over year
- New listings: 4,119, up 1.7 percent year over year
- Average days on market: 84, vs 81 a year ago
- Expired listings: 3,842, up 2.0 percent year over year
Property Type Breakdown
Five property types make up this report, and they did not all move the same way in Q3. One quick note before the detail: the five segments add up exactly to the county totals above, all 2,182 closed sales accounted for.
| Segment | Median price (Q3 average) | Change year over year | Closed sales | Change year over year | Avg days on market |
|---|---|---|---|---|---|
| All Queens (1 to 3 family, condos, coops) | $777,500 | up 7.4% | 2,182 | up 1.6% | 84 |
| 1 Family | $908,000 | up 1.5% | 818 | up 3.4% | 65 |
| 2 Family | $1,154,167 | up 1.8% | 373 | up 13.4% | 80 |
| 3 Family | $1,507,500 | up 1.1% | 64 | down 7.2% | 80 |
| Condo | $627,033 | up 0.6% | 257 | down 8.2% | 114 |
| Coop | $336,463 | up 3.3% | 670 | down 1.2% | 101 |
Sign Up for our Newsletters
A monthly roundup of legislation, articles, and resources specifically related to Queens Homeowners and Homebuyers.
Q3 Snapshot
Home Prices
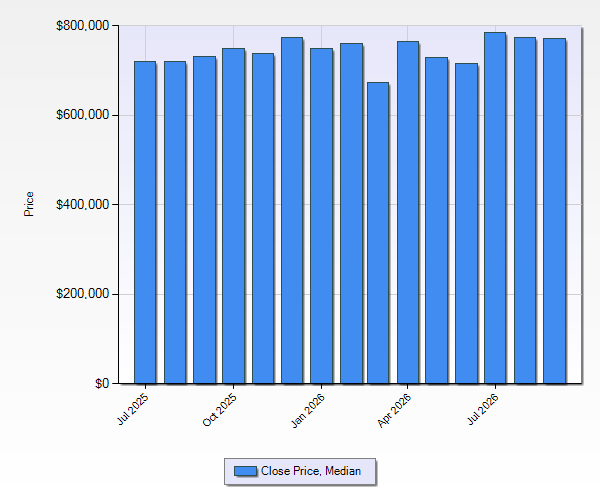
The median closed price averaged $777,500 across the quarter, up 7.4 percent from the $723,877 average in Q3 2025 and up 5.5 percent from Q2 of this year. July set the high mark at $785,000, the highest monthly median in the fifteen months we reviewed. August came in at $775,000 and September at $772,500. Every month of the quarter beat its year ago number, with gains of 9.0 percent in July, 7.6 percent in August, and 5.6 percent in September. Prices are not sprinting the way they did earlier in the decade, but they are moving in one direction: up.
Closed Sales
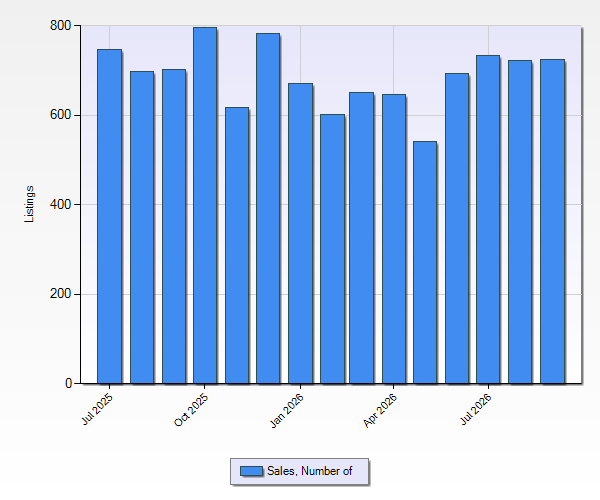
Queens closed 2,182 sales in Q3, up 1.6 percent from 2,147 a year ago and up a strong 16.0 percent from Q2. July was the one soft month, down 1.7 percent year over year at 735 sales. August and September more than made up for it, with 723 and 724 sales, up 3.7 percent and 3.1 percent. Demand is steady, and buyers are closing.
Active Listings
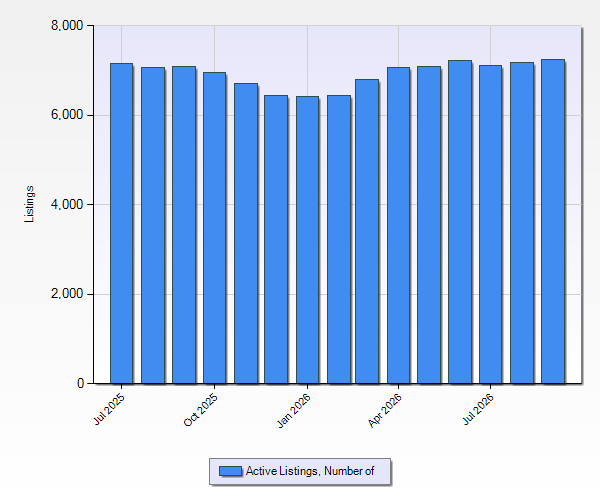
Active listings averaged 7,189 for the quarter, up 1.1 percent year over year. September averaged 7,253 active listings, the highest count in the fifteen month window. New listings totaled 4,119, up 1.7 percent from Q3 2025, and the flow improved as the quarter went on: 1,358 in July, 1,367 in August, 1,394 in September. That is down 8.7 percent from the spring rush in Q2, which is normal for this time of year. The takeaway for buyers is simple: there is more to choose from than there was a year ago.
Days on Market
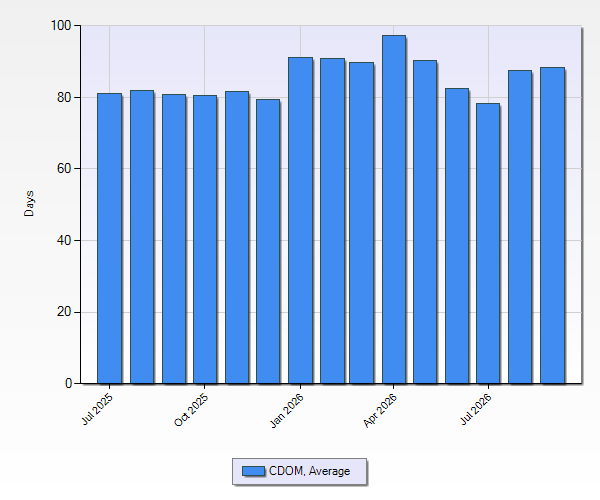
The average cumulative days on market was 84 days in Q3, vs 81 days a year ago. July was the fastest month in the whole window at 78 days, then the pace eased to 87 days in August and 88 in September. Compared with Q2, when homes averaged 90 days, the market actually moved quicker this quarter. Buyers have a bit more room to think than last year, but this is still not a slow market.
Expired Listings
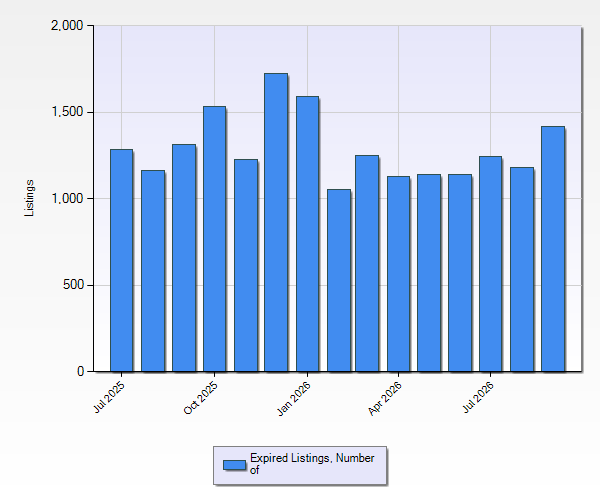
Here is the number we keep coming back to. In Q3, 3,842 listings expired, up 2.0 percent year over year and up 12.5 percent from Q2. September alone saw 1,418 expired listings, slightly more than the 1,394 new listings that came on the market that same month. Two stories are running at once in Queens right now. Homes priced to the market are selling at record prices. Homes priced on hope are sitting, then expiring. The gap between those two outcomes is almost always the asking price.
In a Nutshell
Prices rose again this quarter, so waiting for a big drop has not paid off. The good news is choice: active listings are up, new listings are up, and homes are taking a few more days to sell than they did a year ago. Come in with your financing lined up, know your ceiling, and be ready to move when the right home shows up. Well kept homes in good locations still draw competition.
Demand is real, with 2,182 closed sales and a median price near all time highs. But the expired count is the warning label on this market. Buyers are informed, they can see the whole market on their phones, and they skip overpriced listings fast. Price to the market from day one, present the home well, and you are very likely to land in the group that sells. Reach too high at the start and you risk joining the expired list instead.
Q3 2026 was a strong, steady quarter for Queens. Prices up, sales up, inventory inching up, and a pace that gives both sides a fair shot. We would call it a healthy market with clear rules: value gets rewarded, and overpricing gets exposed.
If you want to know what these numbers mean for your block, your building, or your home, reach out. Local is where the real story lives, and that is our home turf. 718-968-5538
Free Home Valuation
Request a free home valuation from one of our local Queens real estate experts.
The short version: houses carried the quarter. Two family sales surged, one family supply shrank, and prices in every house segment held at or near record levels. Condos were the soft spot, with flat prices and the slowest pace in the county. Coops stayed steady and affordable by Queens standards, with the steadiest price gains in the report. Detail on each segment follows.
1 Family Homes
One family homes are the backbone of the Queens market, and Q3 showed why. This segment made up 37.5 percent of all closed sales in the county this quarter, and it behaved a little differently from the market as a whole.
Q3 at a glance: 1 family homes
- Median closed price (quarter average): $908,000, up 1.5 percent year over year and up 5.7 percent vs Q2
- Closed sales: 818, up 3.4 percent year over year and up 24.7 percent vs Q2
- Active listings (quarter average): 2,152, down 2.7 percent year over year
- New listings: 1,330, down 2.1 percent year over year
- Average days on market: 65, vs 62 a year ago
- Expired listings: 1,245, down 2.3 percent year over year
Free List of Comps
A free list of closed sales, near your property, and sold within the last 6 months.
Prices: steady at the top
The median closed price for a one family home averaged $908,000 in Q3, well above the $777,500 average for the county overall. September set the high mark at $920,000, the highest monthly median for one family homes in the fifteen months we reviewed. July came in at $905,000 and August at $899,000. Year over year gains were modest (1.0 percent in July, 1.3 percent in August, 2.2 percent in September), but measured against Q2 of this year, the quarter average jumped 5.7 percent. Prices in this segment are not racing; they are holding at record levels and edging higher.
Sales: the strongest segment in the county
One family homes closed 818 sales in Q3, up 3.4 percent from 791 a year ago. That growth rate is more than double the 1.6 percent gain for the county overall. July was nearly flat at 281 sales, down 1.4 percent year over year, then August and September took off with 270 and 267 sales, up 6.3 percent and 6.0 percent. Against Q2, sales surged 24.7 percent. When a one family home is priced right in Queens, buyers show up.
Inventory: the exception to the county story
This is where one family homes part ways with the overall numbers. Countywide, active listings rose 1.1 percent year over year. For one family homes, they fell. Active listings averaged 2,152 in Q3, down 2.7 percent from 2,213 a year ago, and new listings totaled 1,330, down 2.1 percent. Fewer owners of one family homes are putting them on the market, and that tight supply is exactly why prices in this segment keep holding near their highs.
Pace: still the fastest homes in Queens
One family homes sold in an average of 65 days in Q3, much faster than the 84 day average for the county overall. That is about two days slower than the 62 day pace a year ago, and quicker than the 68 days this segment averaged in Q2. July ran at 63 days, August at 65, and September at 66. Buyers get a touch more time than last summer, but not much.
Expireds: better than the county, with one warning
Expired listings actually improved in this segment: 1,245 in Q3, down 2.3 percent from 1,274 a year ago, while the county overall saw expireds rise. The warning sits inside September. That month, 469 one family listings expired, up 4.5 percent year over year and 21.8 percent from August, and more than the 431 new one family listings that came on in September. Even in the strongest segment in Queens, an ambitious asking price gets ignored.
Our take
One family homes are where Queens demand runs deepest. Sales grew faster than the county as a whole, supply shrank, and prices finished the quarter at their highest level in over a year. If you own a one family home and you have been waiting for your moment, this is a friendly market for a well priced listing. If you are buying one, expect competition, bring your strongest terms, and do not count on the good ones waiting around.
2 Family Homes
Two family homes are the investor favorite and the classic Queens wealth builder, and Q3 was their busiest quarter in a while. Sales grew faster here than in any other segment we track, and owners listed in bigger numbers too.
Q3 at a glance: 2 family homes
- Median closed price (quarter average): $1,154,167, up 1.8 percent year over year and up 3.4 percent vs Q2
- Closed sales: 373, up 13.4 percent year over year and up 14.4 percent vs Q2
- Active listings (quarter average): 1,403, up 7.7 percent year over year
- New listings: 769, up 12.8 percent year over year
- Average days on market: 80, in line with 80 a year ago
- Expired listings: 715, up 15.0 percent year over year
Sales: the fastest growing segment in Queens
Two family homes closed 373 sales in Q3, up 13.4 percent from 329 a year ago. That is the strongest growth rate of any property type this quarter, well ahead of one family homes at 3.4 percent and the county overall at 1.6 percent. August was the standout month with 127 sales, up 28.3 percent year over year. July also posted 127 sales, up 12.4 percent, and September added 119, up 1.7 percent. This segment made up 17.1 percent of all Queens closings in the quarter. Rental income keeps buyers coming, and this quarter they came in force.
Prices: highest in the county, moving gently
The median closed price averaged $1,154,167 for the quarter, the highest of any segment we track. That is up 1.8 percent from the $1,133,833 average in Q3 2025 and up 3.4 percent from Q2. The monthly medians moved around more than in other segments: $1,155,000 in July, $1,127,500 in August, and $1,180,000 in September. With roughly 120 closings a month, a handful of high priced sales can swing the median, so we read this segment on the quarter, not the month. On the quarter, the direction is clear: steady, modest gains at a very high level.
Inventory: owners are listing
Where one family owners held back, two family owners stepped forward. Active listings averaged 1,403 in Q3, up 7.7 percent year over year, and September reached 1,416, the highest count in the fifteen month window. New listings totaled 769, up 12.8 percent from 682 a year ago, with every month of the quarter ahead of last year. Some of this is owners deciding that record prices are a good exit. Buyers in this segment have more choice than they have had in a while.
Expireds: the fastest growing number in this report
Here is the flip side. Expired listings rose to 715 in Q3, up 15.0 percent year over year, growing even faster than sales. In September, 270 two family listings expired, nearly matching the 272 new listings that came on that month. More owners are testing the market at prices buyers will not pay, especially where the rents do not support the ask. In this segment the math rules everything: if the numbers work at your price, the home sells; if they do not, it sits.
Pace: a tale of two months
Average days on market for the quarter was 80 days, almost identical to the 80 days a year ago and a touch quicker than Q2. The monthly path was wild, though. July averaged just 57 days, the fastest month in the whole window for this segment, then August spiked to 102 days, the slowest month in the window, before September settled at 82. With a smaller pool of sales, a few long sitting listings can move the average a lot, so we do not read too much into any single month here.
Our take
Two family homes had a big quarter: more sales, more listings, and prices holding above $1.15 million at the median. The opportunity cuts both ways. Sellers have an active buyer pool, but the rising expired count says buyers, especially investors, are doing the math and walking away from prices the rents cannot carry. Price it on the income and the comps, and this market will reward you.
3 Family Homes
Three family homes are the rarest of the residential segments we track and the most expensive at the median. Only about 21 sell in Queens in a typical month, so every figure in this section moves more than the others. Read the quarter here, not the month.
Q3 at a glance: 3 family homes
- Median closed price (quarter average): $1,507,500, up 1.1 percent year over year and up 9.5 percent vs Q2
- Closed sales: 64, down 7.2 percent year over year and up 39.1 percent vs Q2
- Active listings (quarter average): 249, down 3.7 percent year over year
- New listings: 144, down 2.7 percent year over year
- Average days on market: 80, vs 91 a year ago
- Expired listings: 122, down 24.7 percent year over year
Prices: the highest medians in Queens
The median closed price averaged $1,507,500 in Q3, the highest of any segment in this report. July came in at $1,500,000, August at $1,475,000, and September at $1,547,500, the strongest month of the quarter. Year over year the quarter average is up a modest 1.1 percent. Against Q2 it is up 9.5 percent, though that comparison flatters a bit: June posted an unusually low $1,250,000 median on only 11 sales, which dragged the Q2 average down. The honest read is that three family prices are holding right around $1.5 million.
Sales: a small segment with a soft year over year line
Queens closed 64 three family sales in Q3, down 7.2 percent from 69 a year ago, making this the only segment in the report with fewer sales than last year. The month to month story was steady rather than weak: 21 sales in July, 21 in August, 22 in September. And against Q2, which managed only 46 sales, the quarter was up 39.1 percent. This segment is just 2.9 percent of all Queens closings, so a slow spring and a normal summer can look like a swing. Underneath, demand for three family homes is thin but consistent.
Inventory: slightly tighter
Active listings averaged 249 in Q3, down 3.7 percent from 259 a year ago. New listings totaled 144, down 2.7 percent. September did bring a healthy 54 new listings, up 25.6 percent year over year and the best month of the quarter for fresh supply. With so few homes in play, one building coming to market is a real event in this segment.
Expireds: the best improvement in the whole report
Expired listings fell to 122 in Q3, down 24.7 percent from 162 a year ago. No other segment improved anywhere near that much. One honest caveat: even after the improvement, this segment still saw roughly two expired listings for every closed sale, the highest churn of any property type. Three family homes are often bought on strict income math and sold by long time owners testing top of the market prices. When the price and the rents line up, they sell. When they do not, the listing tends to expire rather than adjust.
Pace: quicker than last year
Three family homes averaged 80 days on market in Q3, about 11 days faster than the 91 day average a year ago, and far quicker than the 119 day average this segment posted in Q2. July ran 69 days, August 74, and September 96. Monthly numbers in this segment swing hard because the sales pool is small, but the quarter says buyers moved a little faster than they did last summer.
Our take
Three family homes are a niche market inside the Queens market: high prices, few sales, and buyers who run the numbers carefully. Q3 brought steadier sales than the spring, prices holding around $1.5 million, and a welcome drop in expired listings. If you own one, the message from this quarter is encouraging, with one condition: the homes that sell are the ones priced to what the building actually earns.
Condos
Every report has a soft spot, and in Q3 it was condos. This was the one segment where buyers clearly held the leverage: sales slipped, prices went flat, supply grew, and homes took longer to sell than anywhere else in Queens.
Q3 at a glance: condos
- Median closed price (quarter average): $627,033, up 0.6 percent year over year and down 1.0 percent vs Q2
- Closed sales: 257, down 8.2 percent year over year and up 4.0 percent vs Q2
- Active listings (quarter average): 1,243, up 3.6 percent year over year
- New listings: 743, up 13.1 percent year over year
- Average days on market: 114, vs 104 a year ago
- Expired listings: 634, even with a year ago
Sales: the only segment besides 3 family to fall
Queens closed 257 condo sales in Q3, down 8.2 percent from 280 a year ago. July was nearly even at 94 sales, down 1.1 percent, but the quarter faded: August posted 94 sales, down 6.9 percent, and September fell to 69, down 17.9 percent year over year and the softest month in the fifteen month window for this segment. Condos made up 11.8 percent of county closings. Against Q2 sales were up 4.0 percent, so this is a year over year softness story, not a collapse. Still, the direction in September is worth watching.
Prices: flat is the word
The median closed price averaged $627,033 for the quarter, up just 0.6 percent from $623,500 a year ago and down 1.0 percent from Q2. The monthly medians swung with the small sales pool: $657,500 in July, $600,000 in August, $623,600 in September. After a year of steady gains in the houses segments, condo prices have plateaued for now. For buyers who have been priced out of one and two family homes, that flat line is an opening.
Inventory: more choices every month
Active listings averaged 1,243 in Q3, up 3.6 percent year over year, and September reached 1,263, the highest count in the fifteen month window. New listings jumped to 743, up 13.1 percent from 657 a year ago, powered by a late surge: 264 new listings in August, up 28.8 percent year over year, and 254 in September, up 21.5 percent. Supply is arriving faster than demand in this segment, and that imbalance is what gives condo buyers their leverage right now.
Pace: the slow lane of Queens real estate
Condos averaged 114 days on market in Q3, by far the slowest of any segment (one family homes averaged 65 days, the county overall 84). That is about 10 days slower than a year ago. September was the slowest month in the entire fifteen month window at 135 days. Part of this is the nature of condos, with board packages and building finances adding steps. Part of it is buyers taking their time because, in this segment, they can.
Expireds: high churn, no relief
Expired listings totaled 634 in Q3, exactly even with the 634 from a year ago. The flat line hides a hard ratio: for every condo that closed this quarter, about two and a half listings expired, the highest churn of any property type in this report. Sellers are holding firm on price while buyers shop a growing shelf of options. Something has to give, and so far it is the listings that are giving.
Our take
Condos are the buyer friendliest corner of the Queens market right now. Prices have gone flat, selection is the best it has been in over a year, and sellers are competing harder for every showing. If you are buying, this is your segment to negotiate in. If you are selling a condo, price it against the building next door, not against the peak story in the news, and make the home easy to say yes to. The buyers are out there; they are just choosier here than anywhere else in the county.
Coops
Coops are the entry point into Queens homeownership, and the quiet workhorse of this market. They made up 30.7 percent of all closings in Q3, second only to one family homes, at a median price less than half the county figure.
Q3 at a glance: coops
- Median closed price (quarter average): $336,463, up 3.3 percent year over year and up 4.6 percent vs Q2
- Closed sales: 670, down 1.2 percent year over year and up 10.6 percent vs Q2
- Active listings (quarter average): 2,141, up 0.4 percent year over year
- New listings: 1,133, down 6.1 percent year over year
- Average days on market: 101, vs 94 a year ago
- Expired listings: 1,126, up 4.9 percent year over year
Prices: the steadiest climb in the report
The median closed price averaged $336,463 in Q3, up 3.3 percent from $325,833 a year ago and up 4.6 percent from Q2. What stands out is how even the gains were: 4.2 percent in July, 2.5 percent in August, 3.1 percent in September, with monthly medians in a tight band from $330,000 to $340,888. No spikes, no dips, just steady appreciation. At roughly a third of the price of a one family home, coops remain the most reachable way to own in Queens, and buyers are paying a little more for that access every quarter.
Sales: flat for the quarter, strong finish
Queens closed 670 coop sales in Q3, down a slim 1.2 percent from 678 a year ago. The quarter built as it went. July posted 212 sales, down 7.8 percent year over year, and August 211, down 5.0 percent. Then September jumped to 247 sales, up 9.3 percent year over year and the highest monthly total in the fifteen month window for this segment. Against Q2, sales rose 10.6 percent. The year over year line says flat; the September finish says momentum.
Inventory: the largest shelf in Queens, holding steady
Coops carry the largest active inventory of any segment in this report, averaging 2,141 listings in Q3, essentially even with 2,133 a year ago (up 0.4 percent). New listings actually eased to 1,133, down 6.1 percent year over year, so the shelf is not growing. Buyers shopping coops have deep selection without a flood of new competition for sellers, a balance this segment has held all year.
Pace and expireds: a slower, churnier September
Coops averaged 101 days on market in Q3, about a week slower than the 94 day average a year ago, though quicker than the 107 days this segment averaged in Q2. September was the busy, messy month: the most sales of any month in the window (247), a slower 102 day pace (vs 86 last September), and 425 expired listings, up 16.4 percent year over year and more than the 383 new listings that came on. For the quarter, expireds totaled 1,126, up 4.9 percent, or about 1.7 expired listings for every sale. Board approvals and financing add friction to every coop deal, and the September numbers show plenty of listings testing prices the market would not meet.
Our take
Coops are doing exactly what coops are supposed to do in Queens: steady prices, deep selection, and a steady stream of first time buyers and downsizers getting into ownership. The segment is not hot and it is not cold. It is dependable. If you are buying your first home in Queens, this is likely where your search lives, and September showed sellers are motivated to make deals. If you are selling, price with the building and the recent closings in it, because coop buyers compare unit to unit inside the same complex more than anywhere else in this report.
Need Help? Contact Us.
Queens Home Team at Keller Williams Realty Landmark II
718-968-5538
info@nyhometeams.com
Source: OneKey MLS (Matrix) statistics for Queens County, residential 1 to 3 family homes, condos, and coops, July 2025 to September 2026. Median price and days on market figures are monthly figures averaged across the quarter.
